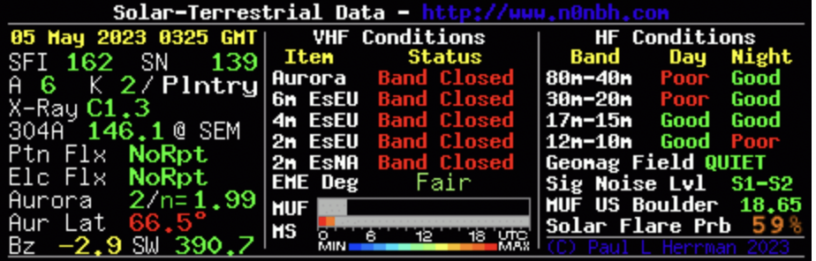

Ever seen the chart above and wondered what all that garble kook meant? Well now you don’t have to rack you brain no more.
Solar terrestrial data, also known as space weather data, is information about the conditions of the space environment around the Earth and the Sun. This data includes measurements of solar activity, geomagnetic activity, and other space weather phenomena.
Solar terrestrial data is important for many applications, including satellite operations, power grid management, and communication systems, such as ham radio. Solar terrestrial data can affect the propagation of radio waves, which can impact communication systems, especially those operating in the high-frequency (HF) range.
The four key solar terrestrial data sets that are important to ham radio include:
- The Solar Flux Index (SFI) is a measure of the strength of the radio emissions from the Sun in the 10.7 centimeter wavelength (2.8 GHz) band. The SFI is an important indicator of solar activity and is used to monitor the level of ionization in the Earth’s ionosphere, which can affect the propagation of radio signals, particularly in the high-frequency (HF) range.
Solar activity, including solar flares and coronal mass ejections, can cause significant variations in the SFI. During periods of high solar activity, the SFI tends to be higher, indicating a stronger radio signal from the Sun. Conversely, during periods of low solar activity, the SFI tends to be lower.
The SFI is expressed in Solar Flux Units (SFU), which is a measure of the radio flux density in the 10.7 cm wavelength band. A typical SFI value ranges from about 60 SFU during periods of low solar activity to over 200 SFU during periods of high solar activity.
A higher solar flux can result in better radio propagation.
70 – Not Good
80 – Good
90 – Better
100+ – Best - Sunspot numbers are a measure of solar activity that are based on the number of sunspots visible on the surface of the Sun. Sunspots are dark regions on the Sun’s surface that are caused by intense magnetic activity. The number of sunspots on the surface of the Sun varies over an approximately 11-year cycle, with a period of high activity followed by a period of low activity.
Solar activity, as measured by sunspot numbers, can have a significant impact on space weather and on Earth’s environment. During periods of high solar activity, the Sun emits more energy and charged particles, which can affect the Earth’s ionosphere, magnetic field, and atmosphere. This can lead to phenomena such as auroras, geomagnetic storms, and radio blackouts.
Sunspot numbers are usually reported as daily, monthly, and yearly averages, and are often used to track the progress of the solar cycle. They are typically expressed as a smoothed value, which removes the daily variations in sunspot numbers to reveal the underlying trend in solar activity.
A higher number means more solar activity, which can result in better radio propagation. - The A-index is a measure of geomagnetic activity that is commonly used to monitor the overall level of geomagnetic disturbances in the Earth’s ionosphere. The A-index is calculated based on the K-index, which is a measure of the magnitude of geomagnetic activity on a scale of 0 to 9. The A-index is the average of the K-index over a 24-hour period and is expressed on a scale of 0 to 400.
Solar weather can affect the A-index by influencing the amount of charged particles that interact with the Earth’s magnetic field. The charged particles come from the solar wind, a stream of plasma that is ejected from the Sun’s corona and can cause geomagnetic storms when it interacts with the Earth’s magnetic field.
During periods of high solar activity, such as during a solar flare or coronal mass ejection, the amount of charged particles entering the Earth’s atmosphere increases, leading to higher levels of geomagnetic activity and a higher A-index. Conversely, during periods of low solar activity, the A-index is typically lower.
A higher A-index can indicate more disturbed conditions, which can result in poor radio propagation.
A = 0 – 7 Quiet
A = 8 – 15 Unsettled
A = 16 – 29 Active
A = 30 – 49 Minor storm
A = 50 – 99 Major storm
A = 100 – 400 Severe storm - The K-index is a measure of geomagnetic activity that is used to monitor the level of disturbances in the Earth’s magnetic field. The K-index is measured on a scale of 0 to 9 and is based on the maximum fluctuations in the Earth’s magnetic field over a three-hour period. The K-index is typically reported in real-time and can be used to forecast the level of geomagnetic activity in the near future.
The K-index is influenced by solar activity, including coronal mass ejections and solar flares, which can cause disturbances in the Earth’s magnetic field. When a large amount of charged particles from the solar wind interact with the Earth’s magnetic field, the K-index can increase, indicating the presence of a geomagnetic storm.
K = 0 Inactive
K = 1 Very quiet
K = 2 Quiet
K = 3 Unsettled
K = 4 Active
K = 5 Minor storm
K = 6 Major storm
K = 7 Severe storm
K = 8 Very severe storm
K = 9 Extremely severe storm
Like the A-index, a high K-index can result in poor radio propagation.
By monitoring and analyzing solar terrestrial data, hams can better understand and predict space weather events, which can help to mitigate their potential impact on HF propagation. It’s important to note that these measures are not the only factors that can affect radio propagation, but they are some of the most commonly used. Keeping track of these measures can help you predict and understand the conditions for radio propagation.

Tim Webb
Very good for those of us not familiar. Keep ’em coming.